
 By

In 2026, a typical 7 kW home solar system in the USA costs roughly $17,500 to $24,500 to install. This is before state or local incentives. It produces 10,000 to 13,500 kWh annually. Production depends on your city’s sunshine.
This guide details what panels produce across the US. It also explains the current incentives landscape. Furthermore, it helps you estimate your own payback with practical examples.
What will my solar system run?
Estimates use the formulas explained in this guide. Plan a complete system with the all-in-one calculator →
How Much Electricity Do Solar Panels Produce in US Cities?
Solar system output varies significantly by location. This is due to differences in sunlight intensity and duration. The formula below provides a reliable estimate. This is for a well-designed system.

kWh per year = System kW × Peak sun hours × 0.80 × 365
The 0.80 factor accounts for typical system losses. These include heat, dust, wiring, and inverter efficiency. Peak sun hours represent the average daily hours of direct sunlight. This is equivalent to 1,000 watts per square meter. We approximate this as yearly averages. This is for a south-facing roof tilted at an optimal angle.
| City | Peak sun hours | kWh per kW per year | 7 kW system per year |
|---|---|---|---|
| Phoenix, AZ | 6.6 | 1,927 | 13,490 |
| Las Vegas, NV | 6.4 | 1,869 | 13,082 |
| Los Angeles, CA | 5.8 | 1,694 | 11,856 |
| Denver, CO | 5.6 | 1,635 | 11,446 |
| Dallas, TX | 5.3 | 1,548 | 10,833 |
| Miami, FL | 5.3 | 1,548 | 10,833 |
| Atlanta, GA | 5.0 | 1,460 | 10,220 |
| New York, NY | 4.6 | 1,343 | 9,402 |
| Chicago, IL | 4.5 | 1,314 | 9,198 |
| Seattle, WA | 3.8 | 1,110 | 7,767 |
The average US home consumes 10,000 to 11,000 kWh annually. A 6 to 8 kW system can substantially cover most homes. This is true in sun-rich regions like the Sunbelt. However, in areas like the Pacific Northwest or the Northeast, you will need a larger array. This is for a similar energy offset. For precise output estimates, use NREL’s free PVWatts tool. You can also consult our peak sun hours guide.
Are solar panels worth it 2026? Costs in the USA
The installed price for a home solar system in 2026 typically ranges from $2.50 to $3.50 per watt. For example, a common 7 kW (7,000 watt) system translates to a total cost of roughly $17,500 to $24,500. This is before any state or local incentives. These prices reflect the cost of panels, inverters, racking, labor, permits, and grid connection.
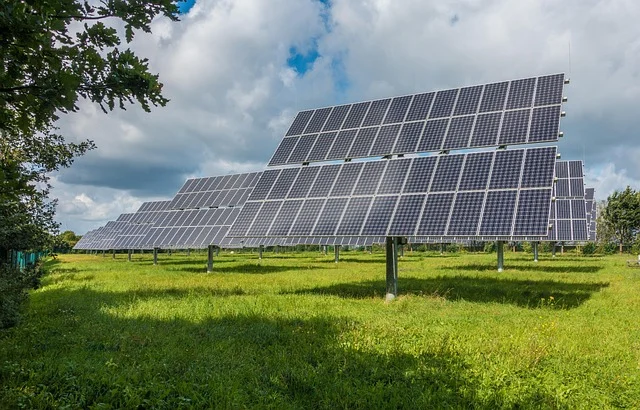
Several factors influence the final price. These include your state’s market and roof complexity. For instance, multiple angles or shading can increase complexity. The chosen equipment, such as premium panels or inverters, also plays a role. Finally, the specific installer’s overhead affects the cost. Always get at least three quotes from different installers. Compare them based on the price per watt. Do not just look at the total system price. This ensures a competitive offer for similar system sizes and components.
Beyond the Initial Purchase: Understanding Ongoing Costs
While solar panels require minimal maintenance, consider these potential ongoing costs:
- Cleaning: Rain typically keeps panels clean. However, occasional cleaning may be beneficial in dusty regions. This also applies to areas with heavy pollen. You can do this yourself or hire a professional service.
- Inverter Replacement: Inverters typically last 10-15 years. You will likely replace your inverter once during the system’s lifetime (around $1,500-$3,000 for a residential unit).
- Insurance: Your homeowner’s insurance policy should cover your solar system. Confirm adequate coverage. Also, understand any premium changes.
- Monitoring: Most modern systems include monitoring apps. Therefore, confirm if these services are included. Also, check if subscription fees apply.
What Incentives Are Available After the Federal Tax Credit in 2026?
The most significant change for solar buyers in 2026 is the absence of the federal Residential Clean Energy Credit. This is Section 25D. It will not apply to systems placed in service after December 31, 2025.

- Bought a system installed in 2025? You are still eligible to claim the 30% credit on your 2025 tax return.
- Buying in 2026? There is no federal tax credit for a system you own, including home batteries.
- Leases and Power Purchase Agreements (PPAs): Companies own leased systems or PPA installations. These companies may still qualify for federal business tax credits. This includes the Investment Tax Credit, or ITC, for a limited time. As a result, leases or PPAs could be more financially attractive. This is an option for some homeowners instead of outright purchase. The company might pass on some savings. However, you must read these contracts carefully. You do not own the system. Also, escalator clauses, which are annual price increases, will significantly impact your long-term savings.
Despite the federal change, a wide array of state, local, and utility programs continue to exist across the USA. These can include:
- State Rebates: Direct cash payments or upfront discounts.
- Property Tax Exemptions: Preventing solar panel value from increasing property taxes.
- Sales Tax Exemptions: Waiving state sales tax on solar equipment.
- Performance-Based Incentives (PBIs): Payments based on actual electricity generated (kWh or Renewable Energy Certificates).
- Low-Interest Loan Programs: State or utility-backed financing to make solar more accessible.
To find specific incentives for your location, consult the DSIRE (Database of State Incentives for Renewables & Efficiency) database. Look for your state’s information. This resource is regularly updated. It provides comprehensive details on available programs.
Net Metering: The Other Half of the Payback
How your utility credits you for surplus electricity sent back to the grid is as crucial for your financial payback as the upfront cost and system output. This mechanism, known as net metering or net billing, directly impacts your monthly savings.
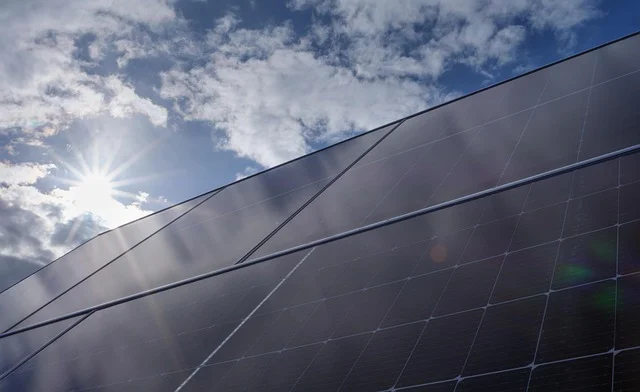
- Full Retail Net Metering: This is the most favorable arrangement. Each kWh you export to the grid earns the same credit as a kWh you purchase from the utility. This effectively means your meter spins backward, leading to the fastest payback periods and maximum savings.
- Net Billing (or Buy-Back Rates): Under net billing, exports are compensated at a lower rate. This rate is less than the retail price of the electricity you buy. Also, this export rate can vary by time of day or season. For example, California transitioned new solar customers to net billing in April 2023. This significantly increased the financial benefits of home batteries. It also maximized self-consumption. This means using your solar power directly instead of exporting it.
- No Compensation or Very Low Export Rates: In some regions, utilities offer minimal or no compensation. This is for exported electricity. In such cases, you must size your system to match your daytime electricity consumption. Do this as closely as possible. Integrating a home battery becomes highly advantageous here. It allows you to store surplus solar energy. You can use it at night or during peak demand periods. This avoids giving it away cheaply.
Understanding your utility’s specific net metering or net billing policy is paramount before investing in solar. These policies can change, so verify the current rules that apply to new solar installations in your service territory.
Worked Example: A 7 kW System in Dallas, TX (2026)
Let’s calculate the potential payback for a 7 kW system in Dallas, TX, using current assumptions. Remember to replace these figures with your own quotes and electricity rates in the calculator for accuracy:
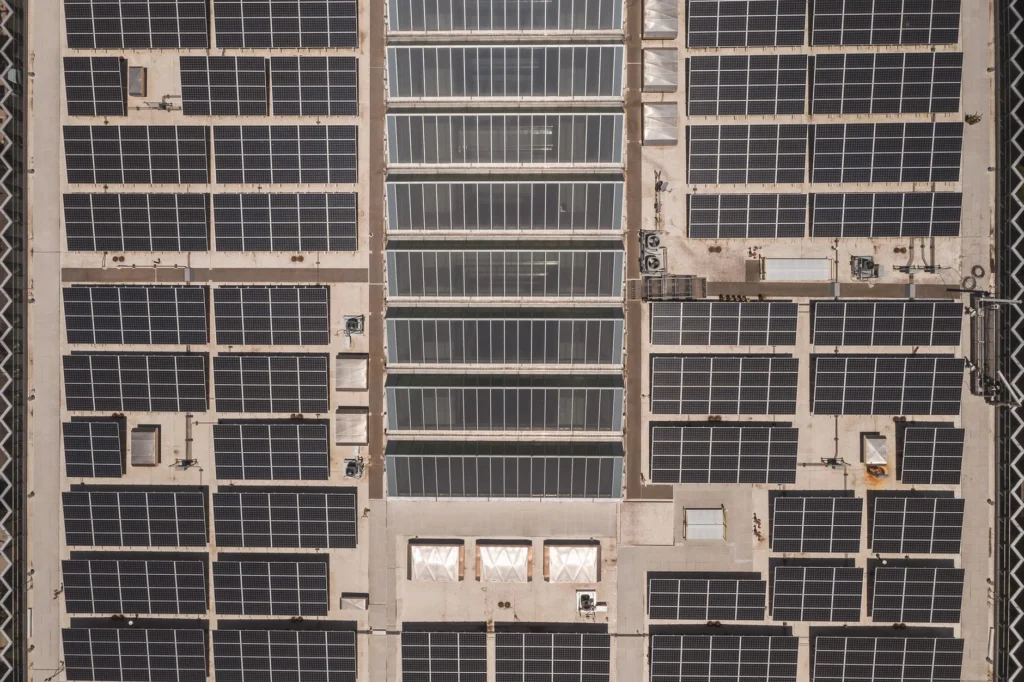
- Output: 7 kW × 5.3 peak sun hours/day × 0.8 (loss factor) × 365 days/year = 10,833 kWh a year
- Average Electricity Price: $0.16 per kWh (with assumed full net metering for simplicity in this example)
- Yearly Savings: 10,833 kWh/year × $0.16/kWh = $1,733
- Installed Cost: 7,000 W × $3.00/W = $21,000 (Note: No federal credit in 2026)
- Simple Payback Period: $21,000 ÷ $1,733/year = about 12 years
The same system in Phoenix, AZ, benefits from more sunshine. It makes 13,490 kWh annually. The average electricity price is lower, at $0.14 per kWh. So, it could still pay back in approximately 11 years. In California, electricity can often cost over $0.30 per kWh. However, exports earn significantly less under net billing. The financial viability often hinges on adding a battery. This maximizes self-consumption. It helps avoid buying expensive grid power. It also minimizes low-value exports.
Should You Add a Home Battery to Your Solar System?
A home battery typically has a 10 to 15 kWh capacity. It offers several key benefits. It provides backup power during grid outages. This is a crucial feature for resilience. It also allows you to store excess solar energy. You generate this energy during the day. Then you can use it at night, increasing your energy independence.
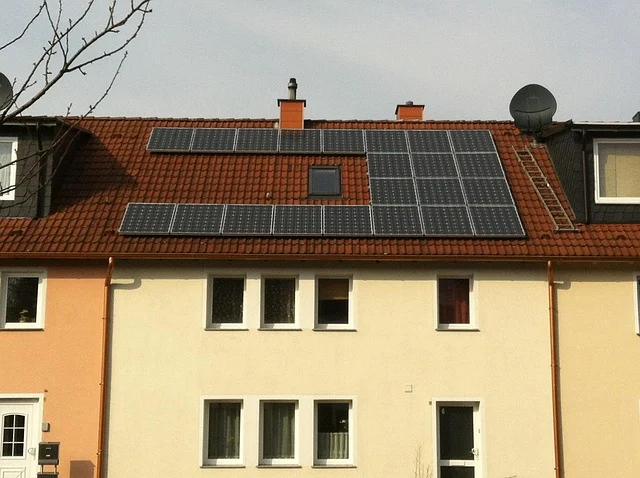
However, a battery rarely pays for itself in 2026. This is true without the 30% federal tax credit. It pays only through savings alone in specific utility conditions. These conditions include utilities that pay very little for exported solar power. This means net billing or no compensation. Other conditions include high time-of-use (TOU) rates. These rates charge significantly more for electricity during evening peak hours. Many buyers add a battery for peace of mind. They also want resilience during power disruptions. This is often their primary motivation. A purely financial return is less important. For more detailed guidance, see our home battery backup size guide.
Is Solar Still Worth It in the US in 2026?
Despite the end of the federal tax credit for homeowners, solar remains a strong investment for many in 2026. It is usually a worthwhile endeavor if:
- Your current electricity costs exceed approximately $0.15 per kWh.
- Your utility offers favorable net metering. Or, it has net billing with a fair export rate. Alternatively, it might have high time-of-use rates. A battery can mitigate these rates.
- Your roof has good sun exposure, ideally facing south, east, or west, with minimal shading.
- You plan to reside in your home for at least 8 to 10 years. This allows sufficient time for the system to pay for itself. Then, it will generate free electricity.
- Your roof is in good condition. It will not require replacement within the next 5-10 years. Removing and reinstalling panels for a new roof adds significant cost.
The investment becomes weaker when electricity prices are very low. It also weakens if your utility offers poor compensation for exports. Another factor is if your roof is nearing the end of its lifespan. In these scenarios, it is often more prudent to replace the roof first. Also, explore community solar options. Or, reconsider if solar is right for your situation at this time.
How to Compare Solar Quotes Effectively
Receiving multiple quotes is essential. However, knowing how to evaluate them critically is even more important. This ensures you get the best value and a reliable system.
- Compare the price per watt ($/W), not just the total price. This metric normalizes costs across different system sizes and helps identify over- or under-priced proposals. Ensure each quote assumes a similar yearly output for a fair comparison.
- Inquire about the specific panels and inverter models included. Research their efficiency ratings, temperature coefficients, and warranties (25-year performance for panels, 10-25 years for inverters).
- Confirm what’s included in the total price. This should cover all permits and interconnection fees. Also, it includes any necessary electrical panel upgrades or roof repairs. The site assessment identifies these. Hidden costs can quickly inflate your final bill.
- Ask for the installer’s estimate of yearly kWh production. Cross-reference this figure with the calculations from the table above or use the NREL PVWatts calculator for independent verification. Significant discrepancies should be a red flag.
- Review the warranty terms for labor and workmanship. A good installer will offer a warranty on their installation work, typically for 10 years or more.
- Check installer credentials. Verify they are licensed and insured. They should also have a strong track record. Look for positive customer reviews.
My 7.5 kW array in central Florida produced 38 kWh on a clear day. I installed it in 2022. It produced about 15 kWh on a heavily cloudy day in October 2026. This aligns well with the formula. For example, Miami’s 5.3 peak sun hours would suggest around 30 kWh/day. This equals 10,833 kWh/year divided by 365 days.

Frequently Asked Questions
Is there still a solar tax credit in 2026?
No, the federal Residential Clean Energy Credit for homeowners ended on December 31, 2025. Homeowners who buy a system installed in 2026 will not receive a federal tax credit. Companies offering solar leases or PPAs may still qualify for business tax credits, which could influence their pricing.
How many kWh does a 7 kW solar system produce in the US?
A 7 kW solar system in the US can produce 7,700 to 13,500 kWh per year. This depends significantly on your geographic location. It also depends on average peak sun hours and system efficiency. Sunnier states like Arizona and Nevada yield higher outputs. This is more than the Pacific Northwest.
How long do solar panels take to pay for themselves in 2026?
The federal tax credit will not be available. Without it, the typical payback period for solar panels in 2026 ranges from 8 to 15 years. Your local electricity rates heavily influence this timeframe. The efficiency of your utility’s net metering or export compensation policy also matters. Finally, the initial installation cost of your system affects the payback period.
Do solar panels work in winter in the northern US?
Yes, solar panels still work in winter in the northern US. However, their production will be lower. This is due to shorter daylight hours and lower sun angles. Snow typically slides off tilted panels. This happens within a day or two of sunshine. Surprisingly, colder temperatures can actually make panels slightly more efficient.
What are the common problems with solar panel systems?
Common problems can reduce output. For example, shading is a common issue. Inverter failures also occur, typically after 10-15 years. Pests can damage wiring. Roof leaks can also happen if installation is incorrect. Regular monitoring helps identify issues early. Also, choose a reputable installer with good warranties. This can mitigate many risks.
Related guides
- Solar Panels UK 2026: Cost, Output by City, SEG Export Rates and Payback
- Solar Panels Canada 2026: Output by City, Rebates by Province and Payback
- Solar Panels Australia 2026: Output by City, Battery Rebate, Feed-in Tariffs and Payback
- Solar Panels in Germany (2026): Output, Feed-in Tariff, Balcony Solar and Payback
Sources and further reading
- IRS: Residential Clean Energy Credit: not available for property placed in service after December 31, 2025.
- DSIRE: Database of State Incentives for Renewables & Efficiency: solar rebates and net metering rules by US state.
- U.S. EIA: How Much Electricity Does an American Home Use?: average household use, about 10,800 kWh a year.
- NREL PVWatts Calculator: solar output estimate for any address.